
Washington Wizards
2016-17What were the Washington Wizards in 2016-17, and what needed front-office attention?
WAS 2016-17: no supported structural problem was identified. The strongest covered areas were Interior finishing, Defensive event creation, Rim pressure. The main rotation-player dependency cases were John Wall, Bradley Beal, Marcin Gortat, Markieff Morris, Otto Porter Jr.. Structural basketball need, injuries, replacement lineups, and financial constraints are reported separately.
What can be trusted
Supported strengths — production, who carries it, and what money is already committed.Full reading
WAS 2016-17 Interior finishing: this was a team strength; production ranked at the 88.5 league percentile. Marcin Gortat supplied 26.6% of the team's above-replacement production in this area. No governed recent game-level availability layer exists for this season. The team already committed substantial or redundant cap resources here.
Full reading
WAS 2016-17 Defensive event creation: this was a team strength; production ranked at the 84.6 league percentile. John Wall supplied 33.0% of the team's above-replacement production in this area. No governed recent game-level availability layer exists for this season. The team already committed substantial or redundant cap resources here.
Full reading
WAS 2016-17 Rim pressure: this was a team strength; production ranked at the 80.8 league percentile. Bradley Beal supplied 27.2% of the team's above-replacement production in this area. No governed recent game-level availability layer exists for this season. The team already committed substantial or redundant cap resources here.
What needs attention
The clearest roster problems the evidence supports.No supported roster problems are on record for this season — team picture available; recent availability layer unavailable.
Every covered basketball function (11)
| Function | Reading | League percentile | Largest contributor | Recent availability | Salary commitment |
|---|---|---|---|---|---|
| Creation | SupportedMiddle-tier area with one-player risk | 31st percentile | John Wall · 53.7% | No recent availability layer for this season | Balanced or context-dependent salary commitment |
| Defensive event creation | SupportedTeam strength | 85th percentile | John Wall · 33.0% | No recent availability layer for this season | Heavy or redundant salary already committed here |
| Interior finishing | SupportedTeam strength | 89th percentile | Marcin Gortat · 26.6% | No recent availability layer for this season | Heavy or redundant salary already committed here |
| Passing connectivity | SupportedMiddle-tier area with one-player risk | 35th percentile | John Wall · 52.1% | No recent availability layer for this season | Balanced or context-dependent salary commitment |
| Point-of-attack defense proxy | WithheldBasketball conclusion withheld | — | Ian Mahinmi | No recent availability layer for this season | Balanced or context-dependent salary commitment |
| Rebounding | SupportedMiddle of the league | 73rd percentile | Marcin Gortat · 29.5% | No recent availability layer for this season | Balanced or context-dependent salary commitment |
| Rim pressure | SupportedTeam strength | 81st percentile | Bradley Beal · 27.2% | No recent availability layer for this season | Heavy or redundant salary already committed here |
| Rim protection | SupportedMiddle of the league | 54th percentile | Marcin Gortat · 25.3% | No recent availability layer for this season | Heavy or redundant salary already committed here |
| Screening | WithheldBasketball conclusion withheld | — | Ian Mahinmi | No recent availability layer for this season | Balanced or context-dependent salary commitment |
| Shooting and spacing | SupportedMiddle of the league | 62nd percentile | Bradley Beal · 35.9% | No recent availability layer for this season | Heavy or redundant salary already committed here |
| Switch coverage proxy | WithheldBasketball conclusion withheld | — | Ian Mahinmi | No recent availability layer for this season | Balanced or context-dependent salary commitment |
Who the team depends on
What disappears when a player is removed — and whether an observed replacement five exists.
WAS was highly dependent on John Wall. Removing him cost about 53.7% of creation production, and lineups with him performed 7.3 points per 100 possessions better than lineups without him. The best supported replacement group was [Ian Mahinmi, Jason Smith, Brandon Jennings, Bojan Bogdanovic, Kelly Oubre Jr.] over 170 possessions.
Replacement evidence
Ian Mahinmi · Jason Smith · Brandon Jennings · Bojan Bogdanovic · Kelly Oubre Jr.
shrunk net 5.354 over 170 possessions — small sample
on floor 6,061 possessions · off floor 2,190 possessions

WAS was highly dependent on Bradley Beal. Removing him cost about 35.9% of shooting production, and lineups with him performed 10.5 points per 100 possessions better than lineups without him. The best supported replacement group was [Ian Mahinmi, Jason Smith, Brandon Jennings, Bojan Bogdanovic, Kelly Oubre Jr.] over 170 possessions.
Replacement evidence
Ian Mahinmi · Jason Smith · Brandon Jennings · Bojan Bogdanovic · Kelly Oubre Jr.
shrunk net 5.354 over 170 possessions — small sample
on floor 5,760 possessions · off floor 2,491 possessions

WAS was highly dependent on Marcin Gortat. Removing him cost about 26.6% of interior finish production, and lineups with him performed 5.1 points per 100 possessions better than lineups without him. The best supported replacement group was [Ian Mahinmi, Jason Smith, Brandon Jennings, Bojan Bogdanovic, Kelly Oubre Jr.] over 170 possessions.
Replacement evidence
Ian Mahinmi · Jason Smith · Brandon Jennings · Bojan Bogdanovic · Kelly Oubre Jr.
shrunk net 5.354 over 170 possessions — small sample
on floor 5,371 possessions · off floor 2,880 possessions
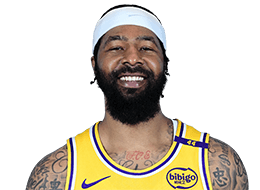
WAS was highly dependent on Markieff Morris. Removing him cost about 28.0% of rebounding production, and lineups with him performed 6.8 points per 100 possessions better than lineups without him. The best supported replacement group was [Marcin Gortat, John Wall, Bradley Beal, Otto Porter Jr., Kelly Oubre Jr.] over 417 possessions.
Replacement evidence
Marcin Gortat · John Wall · Bradley Beal · Otto Porter Jr. · Kelly Oubre Jr.
shrunk net 6.614 over 417 possessions
on floor 4,982 possessions · off floor 3,269 possessions

WAS lineups performed 6.5 points per 100 possessions better with Otto Porter Jr. than without him. The best supported alternative was [Ian Mahinmi, Jason Smith, Brandon Jennings, Bojan Bogdanovic, Kelly Oubre Jr.] over 170 possessions.
Replacement evidence
Ian Mahinmi · Jason Smith · Brandon Jennings · Bojan Bogdanovic · Kelly Oubre Jr.
shrunk net 5.354 over 170 possessions — small sample
on floor 5,512 possessions · off floor 2,739 possessions
Function loss, lineup performance, and replacement-lineup evidence remain separate; none is causal player value.
What injuries change
Recent absences and the basketball needs they created or worsened.No governed recent game-level availability layer exists for this season.
Where money is tied up
Cap position and salary allocation — shown beside the basketball picture, never blended into it.Most salary is mapped to interior finishing; the highest-need area is creation. Salary-to-function mapping covers 91% of charges.
Exact figures
Exact transaction legality withheld — no exception-usage, cap-hold, and transaction ledger evidence.
What the evidence cannot answer
Deliberate abstentions — where the database refuses a conclusion rather than guessing.- Point-of-attack defense proxy: Basketball conclusion withheld
- Screening: Basketball conclusion withheld
- Switch coverage proxy: Basketball conclusion withheld
Exact transaction legality: Exact transaction legality withheld — no exception-usage, cap-hold, and transaction ledger evidence
Team-season situation report. Structural basketball quality, recent availability, player dependence, replacement lineups, and financial position remain separate. No acquisition recommendation, transaction grade, coaching grade, outcome claim, or causal value is inferred.