
New Orleans Pelicans
2017-18What were the New Orleans Pelicans in 2017-18, and what needed front-office attention?
NOP 2017-18: no supported structural problem was identified. The strongest covered areas were Rim pressure, Interior finishing, Passing connectivity. The main rotation-player dependency cases were Anthony Davis, Darius Miller. Structural basketball need, injuries, replacement lineups, and financial constraints are reported separately.
What can be trusted
Supported strengths — production, who carries it, and what money is already committed.Full reading
NOP 2017-18 Rim pressure: this was a team strength; production ranked at the 96.3 league percentile. Anthony Davis supplied 36.7% of the team's above-replacement production in this area. No governed recent game-level availability layer exists for this season. The team already committed substantial or redundant cap resources here.
Full reading
NOP 2017-18 Interior finishing: this was a team strength; production ranked at the 92.6 league percentile. Anthony Davis supplied 34.3% of the team's above-replacement production in this area. No governed recent game-level availability layer exists for this season. The team already committed substantial or redundant cap resources here.
Full reading
NOP 2017-18 Passing connectivity: this was a team strength; production ranked at the 81.5 league percentile. Jrue Holiday supplied 32.1% of the team's above-replacement production in this area. No governed recent game-level availability layer exists for this season. The team already committed substantial or redundant cap resources here.
What needs attention
The clearest roster problems the evidence supports.No supported roster problems are on record for this season — team picture available; recent availability layer unavailable.
Every covered basketball function (11)
| Function | Reading | League percentile | Largest contributor | Recent availability | Salary commitment |
|---|---|---|---|---|---|
| Creation | SupportedMiddle of the league | 74th percentile | Jrue Holiday · 34.9% | No recent availability layer for this season | Heavy or redundant salary already committed here |
| Defensive event creation | SupportedMiddle of the league | 70th percentile | Anthony Davis · 34.5% | No recent availability layer for this season | Heavy or redundant salary already committed here |
| Interior finishing | SupportedTeam strength | 93rd percentile | Anthony Davis · 34.3% | No recent availability layer for this season | Heavy or redundant salary already committed here |
| Passing connectivity | SupportedTeam strength | 82nd percentile | Jrue Holiday · 32.1% | No recent availability layer for this season | Heavy or redundant salary already committed here |
| Point-of-attack defense proxy | WithheldBasketball conclusion withheld | — | Walt Lemon Jr. | No recent availability layer for this season | Balanced or context-dependent salary commitment |
| Rebounding | SupportedMiddle-tier area with one-player risk | 41st percentile | Anthony Davis · 55.3% | No recent availability layer for this season | Balanced or context-dependent salary commitment |
| Rim pressure | SupportedTeam strength | 96th percentile | Anthony Davis · 36.7% | No recent availability layer for this season | Heavy or redundant salary already committed here |
| Rim protection | SupportedMiddle-tier area with one-player risk | 33rd percentile | Anthony Davis · 51.9% | No recent availability layer for this season | Balanced or context-dependent salary commitment |
| Screening | WithheldBasketball conclusion withheld | — | Walt Lemon Jr. | No recent availability layer for this season | Balanced or context-dependent salary commitment |
| Shooting and spacing | SupportedMiddle-tier area with one-player risk | 33rd percentile | E'Twaun Moore · 49.1% | No recent availability layer for this season | Balanced or context-dependent salary commitment |
| Switch coverage proxy | WithheldBasketball conclusion withheld | — | Walt Lemon Jr. | No recent availability layer for this season | Balanced or context-dependent salary commitment |
Who the team depends on
What disappears when a player is removed — and whether an observed replacement five exists.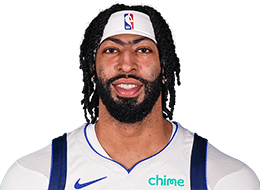
NOP was highly dependent on Anthony Davis. Removing him cost about 34.3% of interior finish production, and lineups with him performed 9.1 points per 100 possessions better than lineups without him. The best supported replacement group was [Rajon Rondo, Jrue Holiday, Dante Cunningham, DeMarcus Cousins, E'Twaun Moore] over 175 possessions.
Replacement evidence
Rajon Rondo · Jrue Holiday · Dante Cunningham · DeMarcus Cousins · E'Twaun Moore
shrunk net -2.323 over 175 possessions — small sample
on floor 5,792 possessions · off floor 2,461 possessions

NOP did not have strong functional backup for Darius Miller in shooting; removing him cost about 33.7% of the team's production in that area. The next observed option was E'Twaun Moore.
Replacement evidence
Jrue Holiday · Dante Cunningham · DeMarcus Cousins · E'Twaun Moore · Anthony Davis
shrunk net 11.702 over 358 possessions
on floor 3,837 possessions · off floor 4,381 possessions
Function loss, lineup performance, and replacement-lineup evidence remain separate; none is causal player value.
What injuries change
Recent absences and the basketball needs they created or worsened.No governed recent game-level availability layer exists for this season.
Where money is tied up
Cap position and salary allocation — shown beside the basketball picture, never blended into it.Most salary is mapped to interior finishing; the highest-need area is shooting and spacing. Salary-to-function mapping covers 82% of charges.
Exact figures
Exact transaction legality withheld — no exception-usage, cap-hold, and transaction ledger evidence.
What the evidence cannot answer
Deliberate abstentions — where the database refuses a conclusion rather than guessing.- Point-of-attack defense proxy: Basketball conclusion withheld
- Screening: Basketball conclusion withheld
- Switch coverage proxy: Basketball conclusion withheld
Exact transaction legality: Exact transaction legality withheld — no exception-usage, cap-hold, and transaction ledger evidence
Team-season situation report. Structural basketball quality, recent availability, player dependence, replacement lineups, and financial position remain separate. No acquisition recommendation, transaction grade, coaching grade, outcome claim, or causal value is inferred.